Overview
This project explores the development of a day trading strategy using publicly available stock market data from the S&P 500. By combining statistical analyses, network theory, clustering techniques, and portfolio optimization, the aim is to identify promising stocks and allocate funds efficiently. While still a work in progress, this project demonstrates the complexity and iterative nature of building data-driven financial models.
You can find the code for this project in my GitHub repository.
Project Workflow
The project consists of several interconnected steps, each addressing a specific aspect of the trading strategy:
1. Data Collection and Preparation
- Stock List Compilation: Scraped the list of S&P 500 components from Wikipedia.
- Historical Data Download: Retrieved stock data using the
yfinancelibrary. - Data Cleaning and Transformation:
- Combined and stacked data for easier analysis.
- Calculated daily growth rates for each stock.
2. Benchmarking and Network Analysis
- Performance Metrics: Computed average performance metrics for individual stocks.
- Network Construction:
- Created a correlation matrix of daily returns.
- Derived a network of “neighbors” for each stock, identifying those with similar return patterns.
3. Clustering
- Used spectral clustering on the correlation matrix to group stocks into economic sectors or market segments, providing additional structure for portfolio selection.
4. Portfolio Selection
- Integrated insights from:
- Network neighbors.
- Market segments.
- Historical performance benchmarks.
- Selected a small set of promising stocks for further analysis.
Kelly Optimization for Portfolio Allocation
The project incorporates the Kelly Criterion, an advanced method for optimal fund allocation. This approach maximizes expected long-term portfolio growth by balancing risk and reward:
- Implementation: Leveraged the Ledoit-Wolf Estimator and Linear Programming for optimization.
- Challenges:
- Inconsistent solutions requiring fallback mechanisms (e.g., random selection).
- Iterative improvements needed to ensure reliable results.
Simulating the Trading Strategy
- Trading Simulation:
- Simulated daily trading over a specified time window.
- Stocks were bought at the opening price and sold at the closing price of the same day.
- Benchmark Comparison:
- Compared performance against a simple buy-and-hold strategy using random stock selections.
- Visualization:
- Plotted portfolio value development over the trading window.
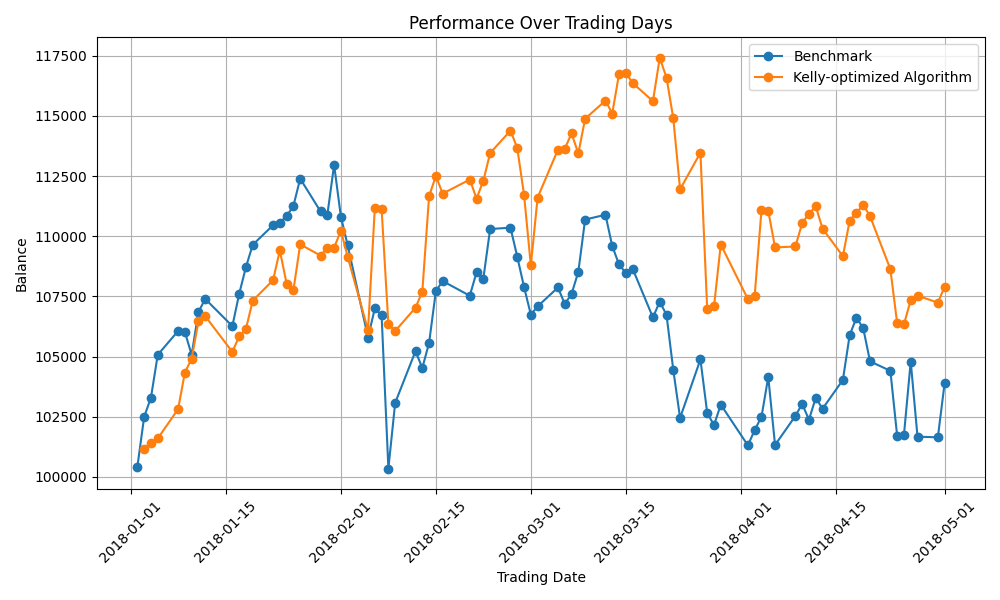
The plot shows one simulation run of the algorithm for a 90-day window at the start of 2018. In this particular window (and one single run), the algorithm performed slightly better than the benchmark. But, of course, this is far from sufficient to conclude that our algorithm outperforms the benchmark. A lot more simulation runs over a lot more different time periods are still needed. This is just one of the many limitations of this work in progress.
Current Limitations
This project is still under development, with several areas requiring improvement:
- Optimization Challenges: Kelly Optimization sometimes fails to converge, necessitating fallback mechanisms.
- Data Updates: Automating data downloads for real-time analysis.
- Costs and Fees: Incorporating transaction costs and buy-sell spreads.
- User Interface: Enhancing usability with structured prompts or a user-friendly interface.
- Version Control: Improving project organization and modularity for better maintainability.
- Intraday Trading: Expanding the strategy to include intraday data for more granular decision-making.
Future Directions
- Enhanced Data Analysis: Implementing topic modeling or sentiment analysis for additional stock insights.
- Improved Benchmarks: Developing more robust comparison strategies.
- User Accessibility: Creating a user interface or Jupyter Notebook pipeline for easier interaction.
- Advanced Features:
- Adding support for intraday trading decisions.
- Incorporating more sophisticated cost models.
Conclusion
This project represents an ongoing effort to develop a data-driven day trading strategy for the S&P 500. While significant progress has been made, particularly in data collection, clustering, and portfolio optimization, the project remains a work in progress with plenty of room for refinement. Stay tuned for updates as the strategy evolves!
